Cohort/Cluster Leaders
Accessing Manager Functions

Managers have access to nThrive Education's powerful manager dashboard features. After logging in, this dashboard can be accessed by navigating to http://nlearn.nthriveeducation.com/dashboard or by clicking the My Dashboard link in the Navigation bar (shown above).
The nav block on the left lists available options. Clicking any of the options opens the tasks focused on the team members you lead.
Enrollment
Bulk Enrollment
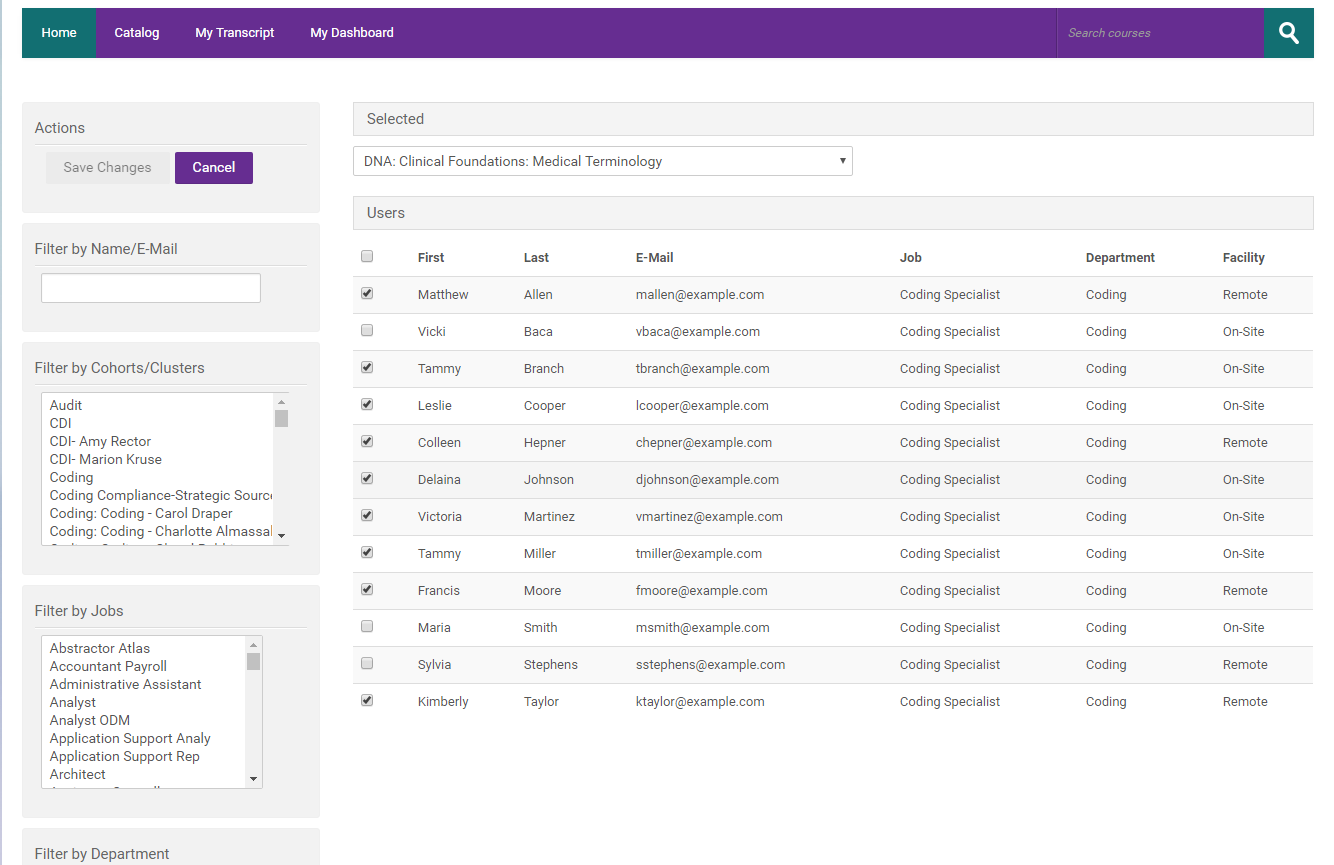
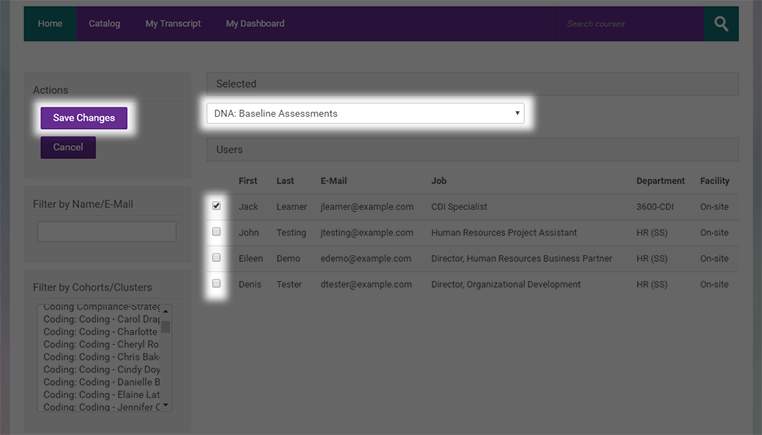
Bulk Enrollment is the assignment of a track to a group of learners, selected individually or all at once, by choosing the track, filtering a selection of learners, then saving their enrollment. Additionally, this feature shows which users are currently enrolled in a track when it is selected. The checkboxes next to the learners who are currently enrolled are checked. Checking boxes that were not already checked, then saving, adds those learners to the track. Unchecking the checkbox will remove those learners from the track.
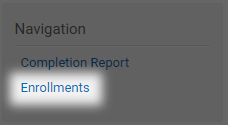
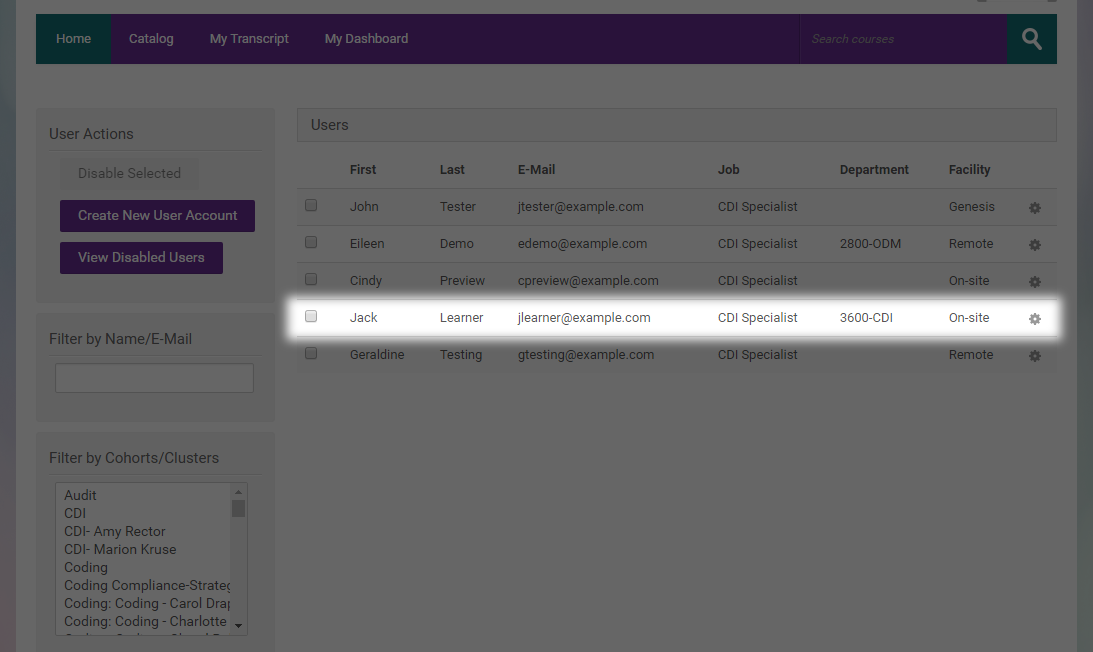
Click on the Enrollments option to view your users.
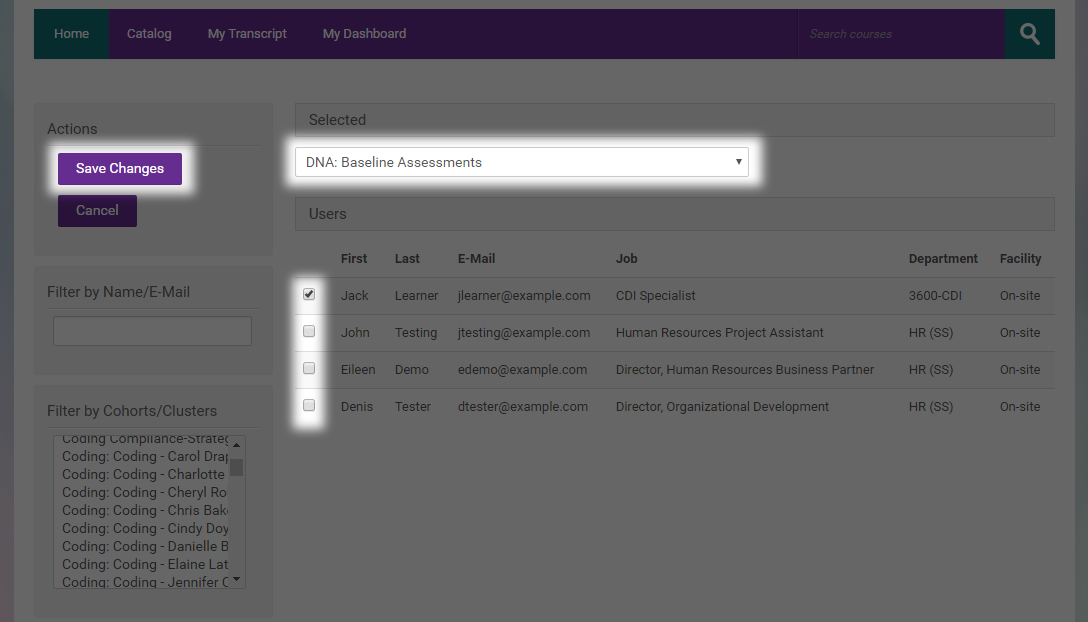
Select the track to assign by choosing its title from the drop-down menu at the top of the screen. Your team members will be listed and the currently enrolled learners' checkboxes will automatically become checked. Filters may be applied to narrow down the list of users for a more precise selection. Check the boxes of any learners to be added to the track. Alternatively, the checkbox at the top of of the list of learners may be clicked to toggle all of the checkboxes at once. Lastly, click the Save Changes button in the Actions nav block on the left to submit the changes made.
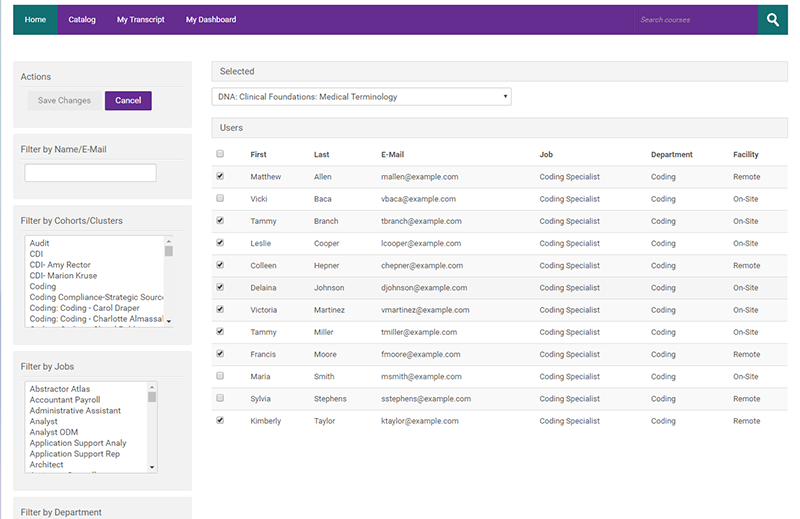
Filters
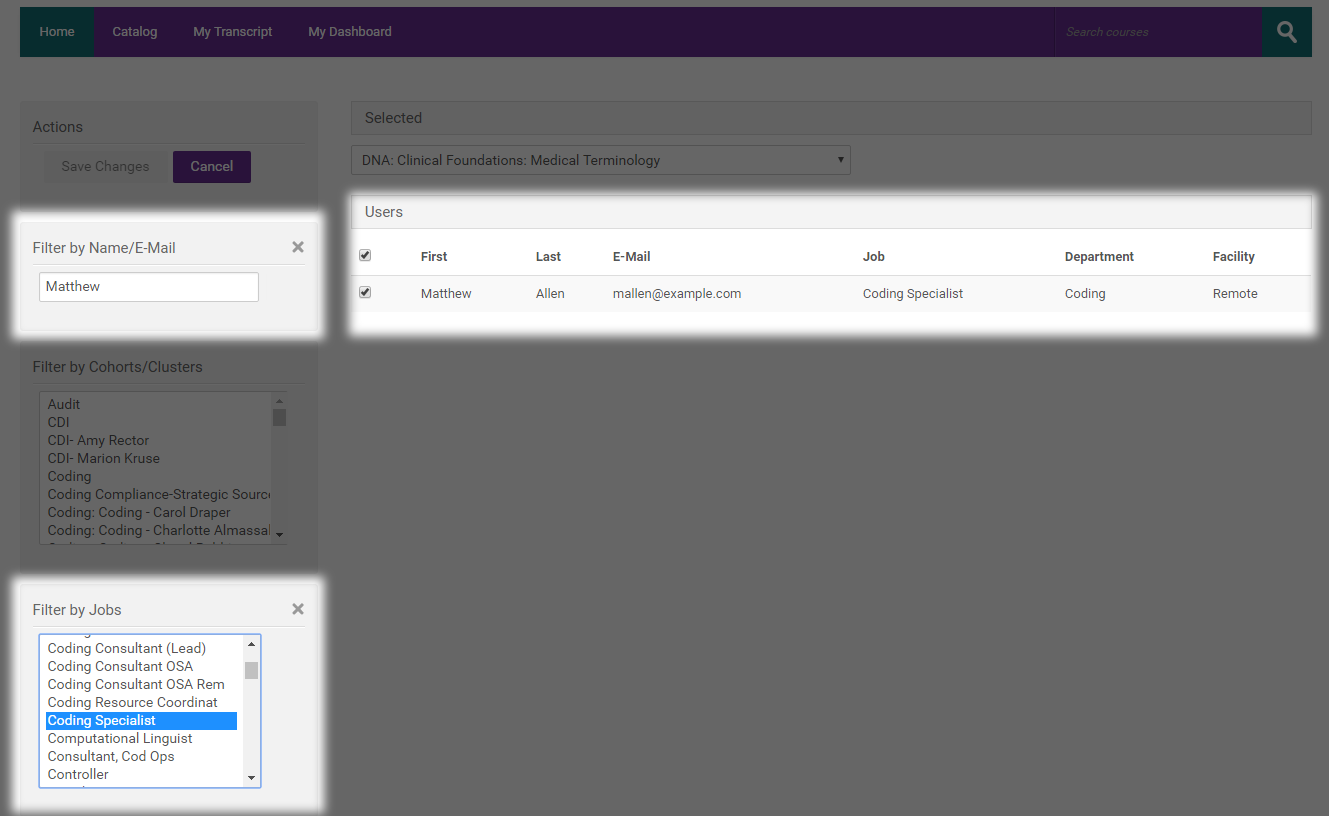
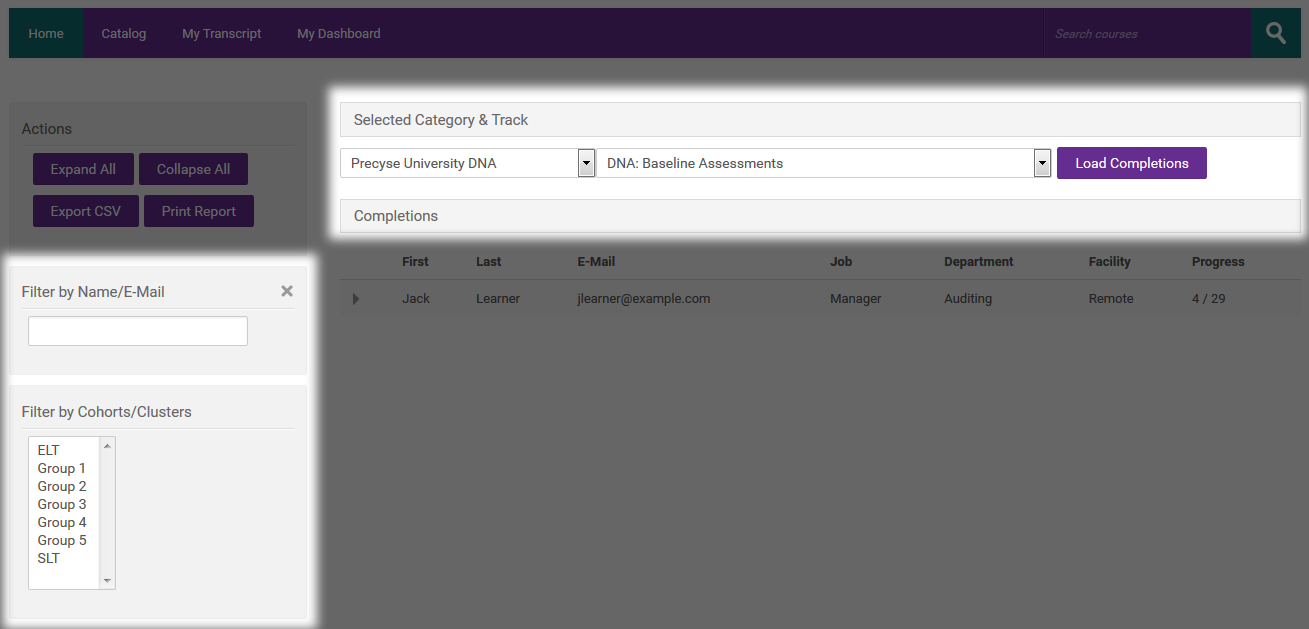
While managing learners within a Cohort, it may become necessary to reduce the list of learners to a list based on a set of conditions. Example: If only the nursing department needs to be addressed, a filter may be applied to show only learners in the nursing department.
To apply a filter, click on a list item in any of the Filter by... nav blocks on the left. To select multiple filter criteria, hold the ctrl key (cmd key on Mac) while selecting new criteria. Conversely, to deselect a selected filter criterion, hold the ctrl key (cmd key on Mac) and click a selected criterion.
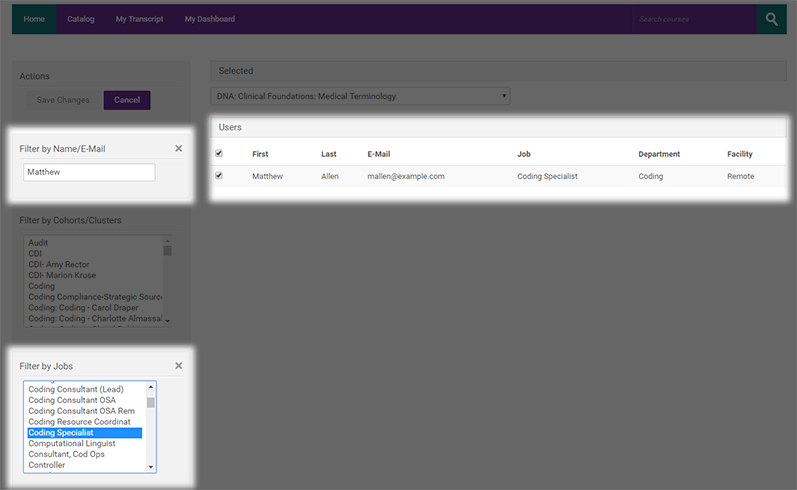
As an example, a filter has been applied to display only the learners with the name “Matthew” and “Coding Specialist” job. Because Matthew Allen is the only user to meet these criteria, he is the only learner that displays.
Reporting
Cohort/Cluster Completion Reports
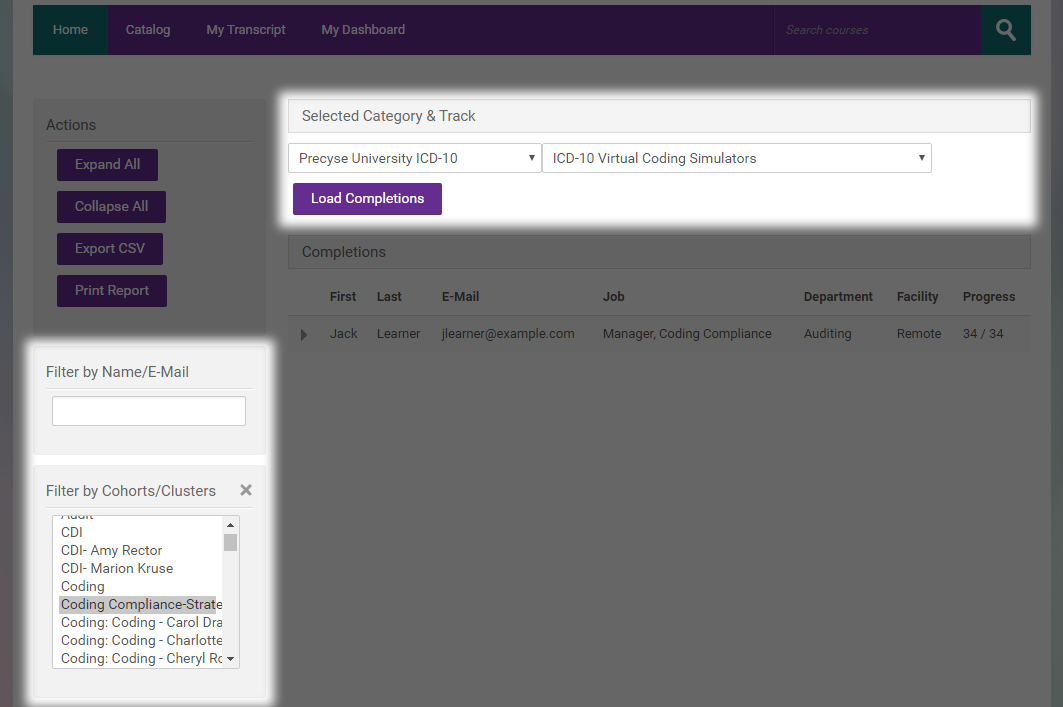
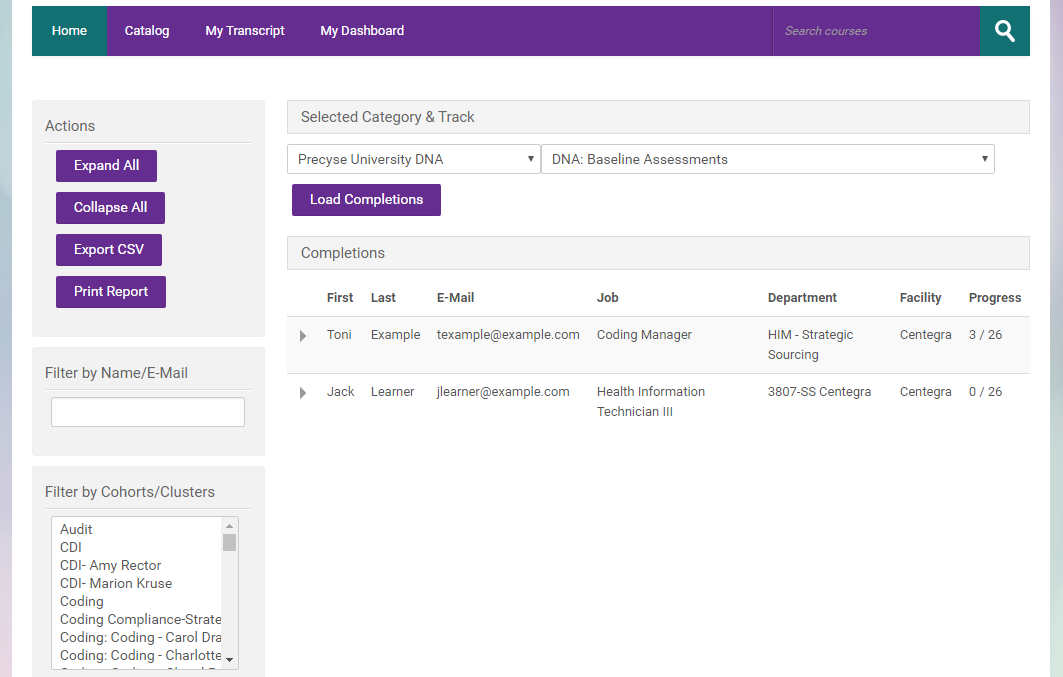
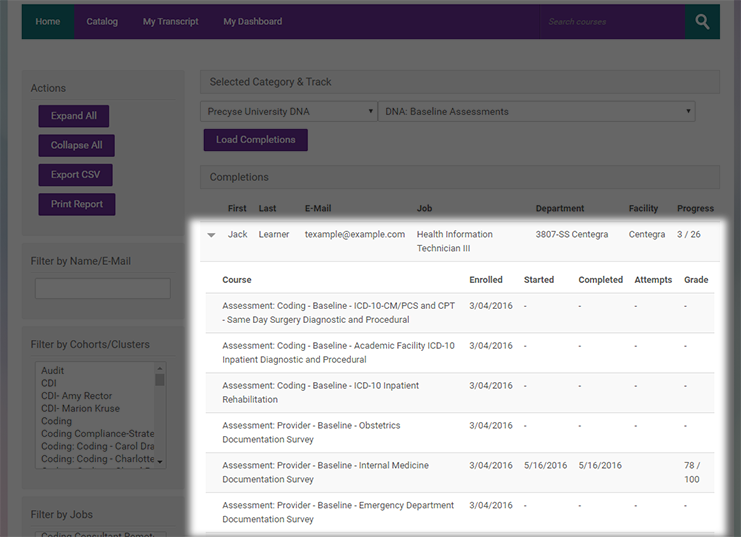
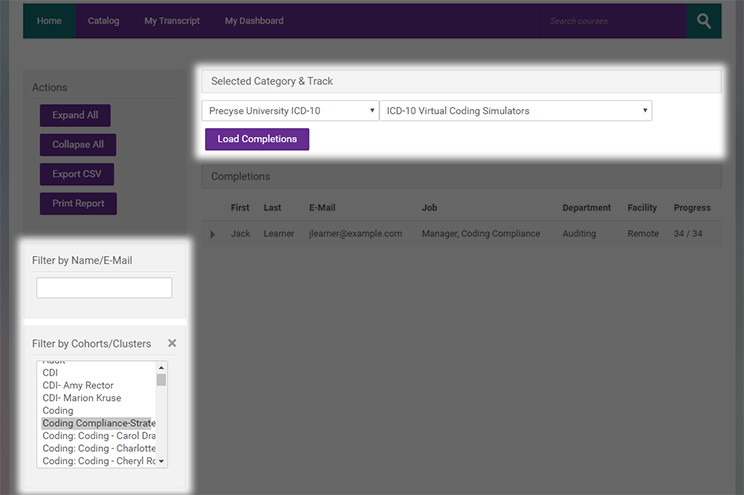
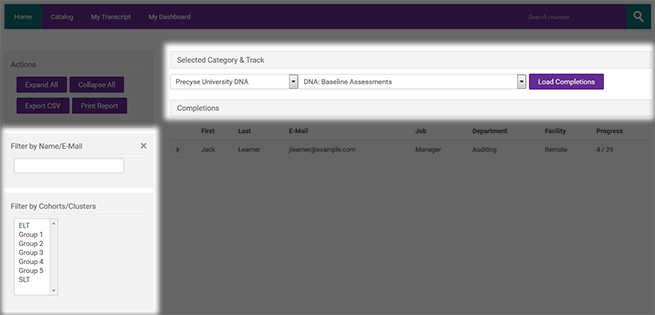
The completion report is initially filtered by selecting the Category and Track. To view the completion records click Load Completions.

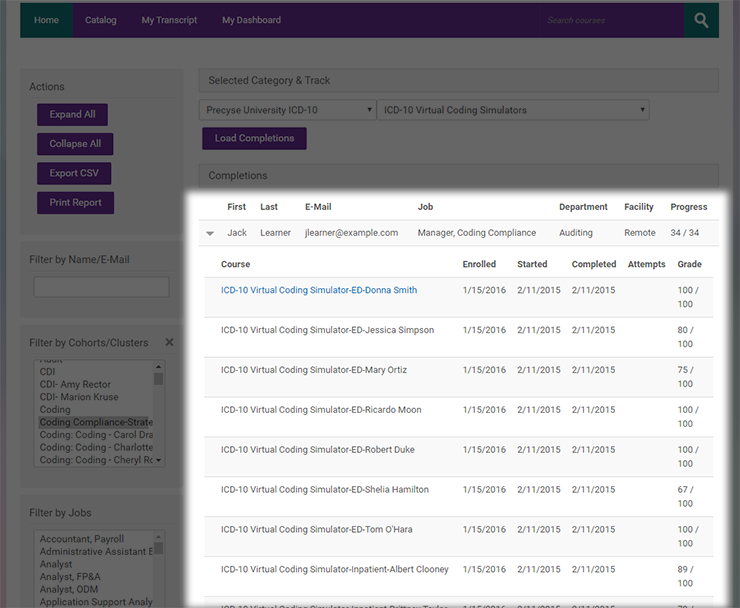
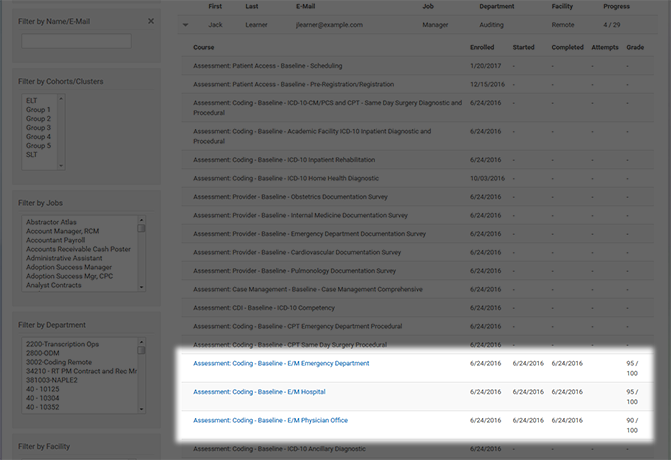
Reports are presented in groups by Cohort. To view the completion of an individual learner in a Cohort, click the  icon in the first column next to the learner's name.

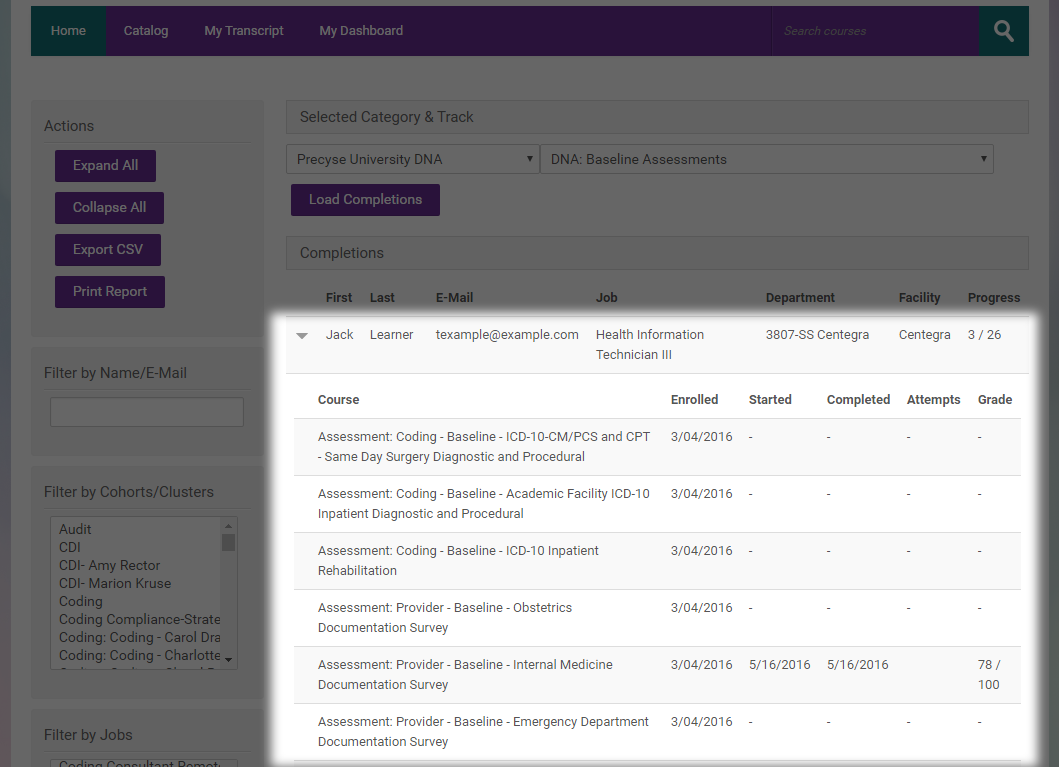
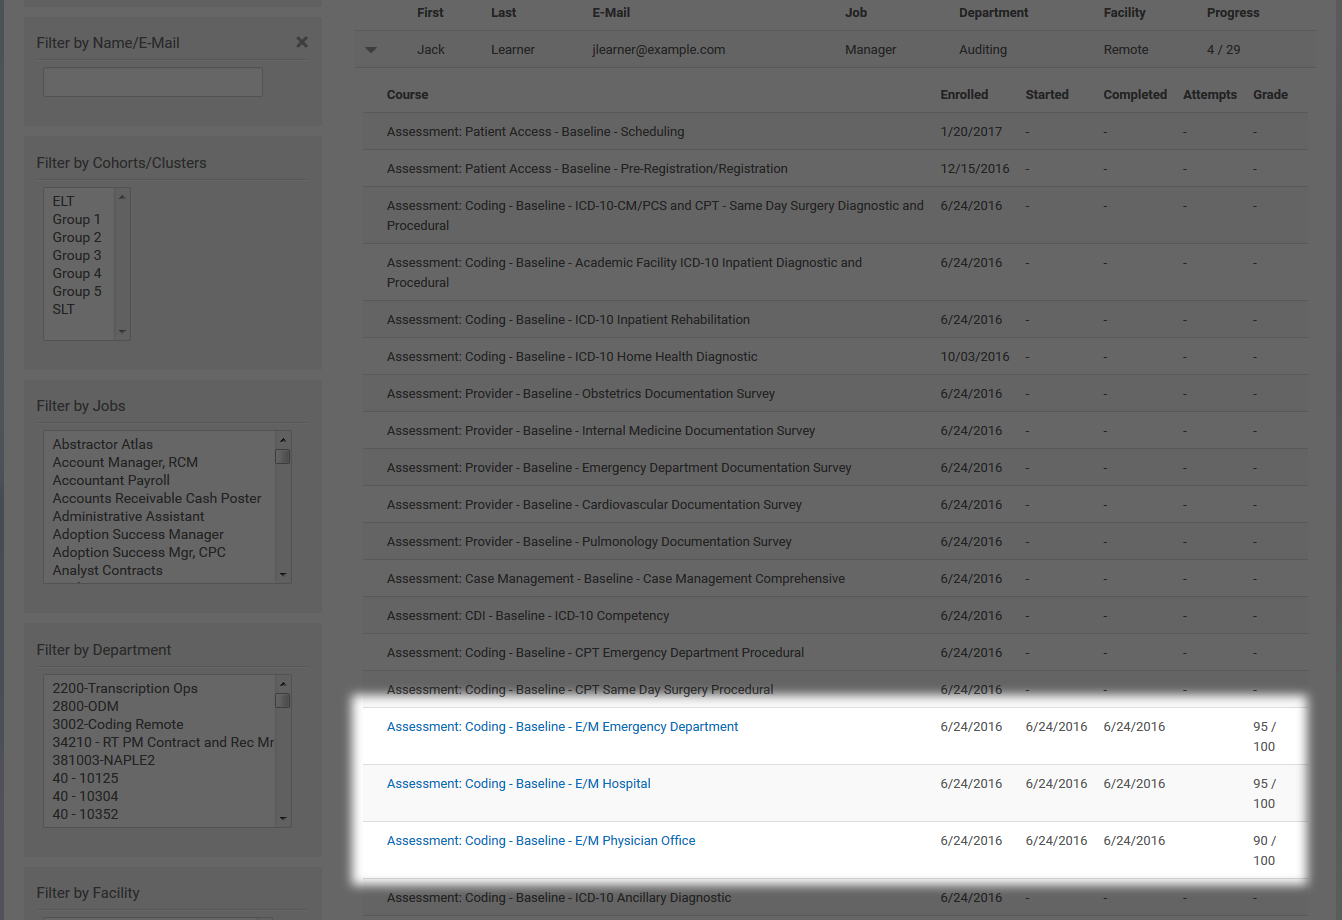
As an example, Jack Learner's report has been opened to reveal his Course and Track completion progress. The Attempts column displays the number of times the learner has attempted the quiz.
Downloading Reports to CSV
To download all of the learner completion progress to a comma separated values (.csv) file, click the Export CSV button on the Cohort Completion Report page. A link to download the report will be emailed to you after it has been generated. This link will expire after 48 hours. With a .csv file, learner data can be shaped into graphs, organized by custom criteria, and transformed for other presentation purposes with your favorite spreadsheet application, like Microsoft Excel.
Simulator Reporting
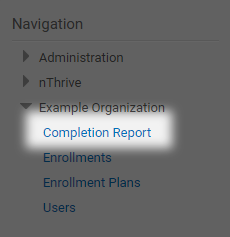
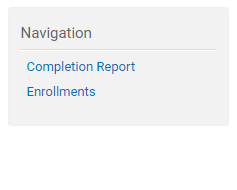
Click the  next to the Cohort you lead and click on the Completion Report option.
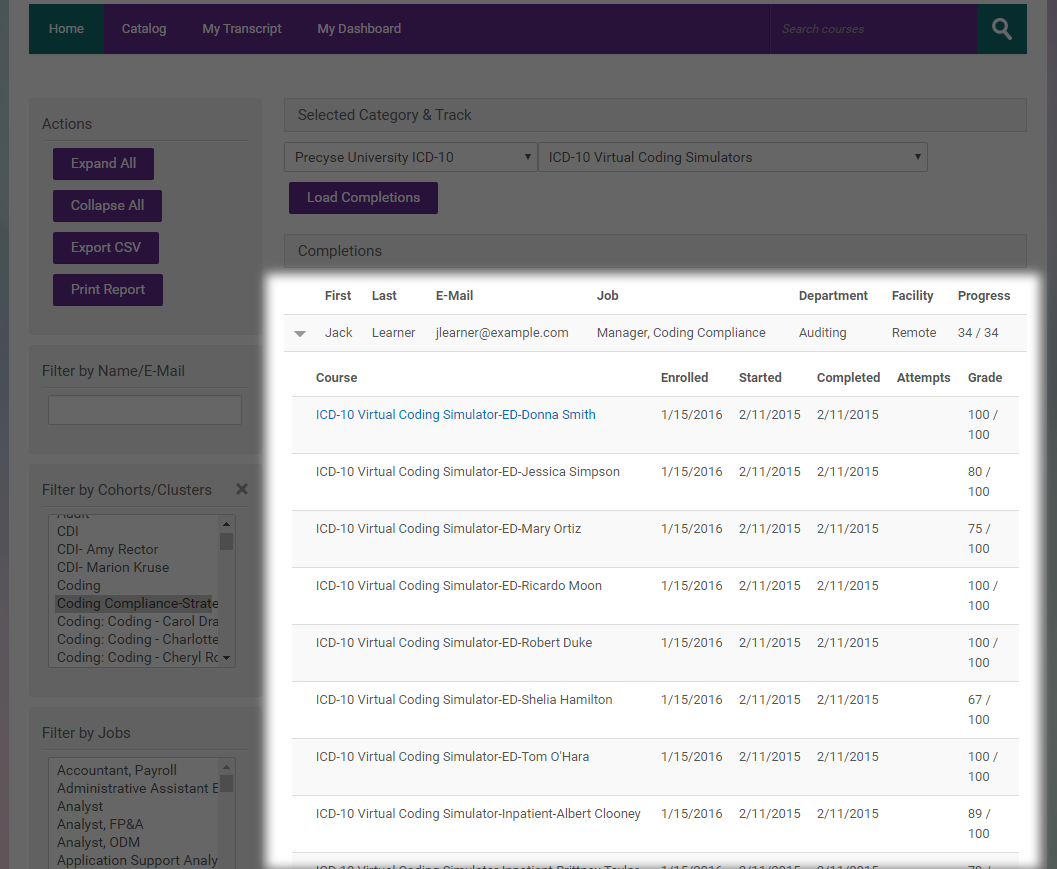
Select the Category and Track at the top of the page and then click Load Completions. Using the filters on the left-hand side, locate the learner you would like to view by clicking on their Cohort, job, department, and/or facility..
Click on the icon on the left of the learner name to expand the Track and view the Courses. This provides an overview of enrollment dates, when the learner started/completed the course, number of attempts, and grade for each course.
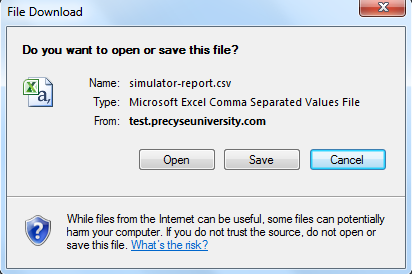
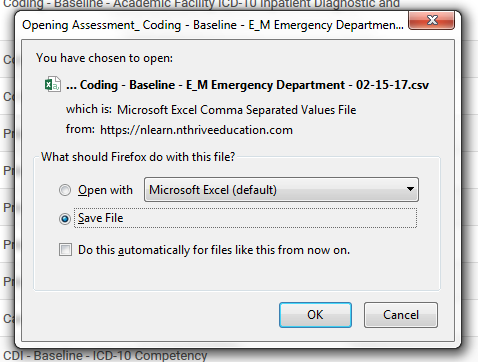
Click on the course to view and a CVS file will begin to download in your browser. Click Open to open the file.
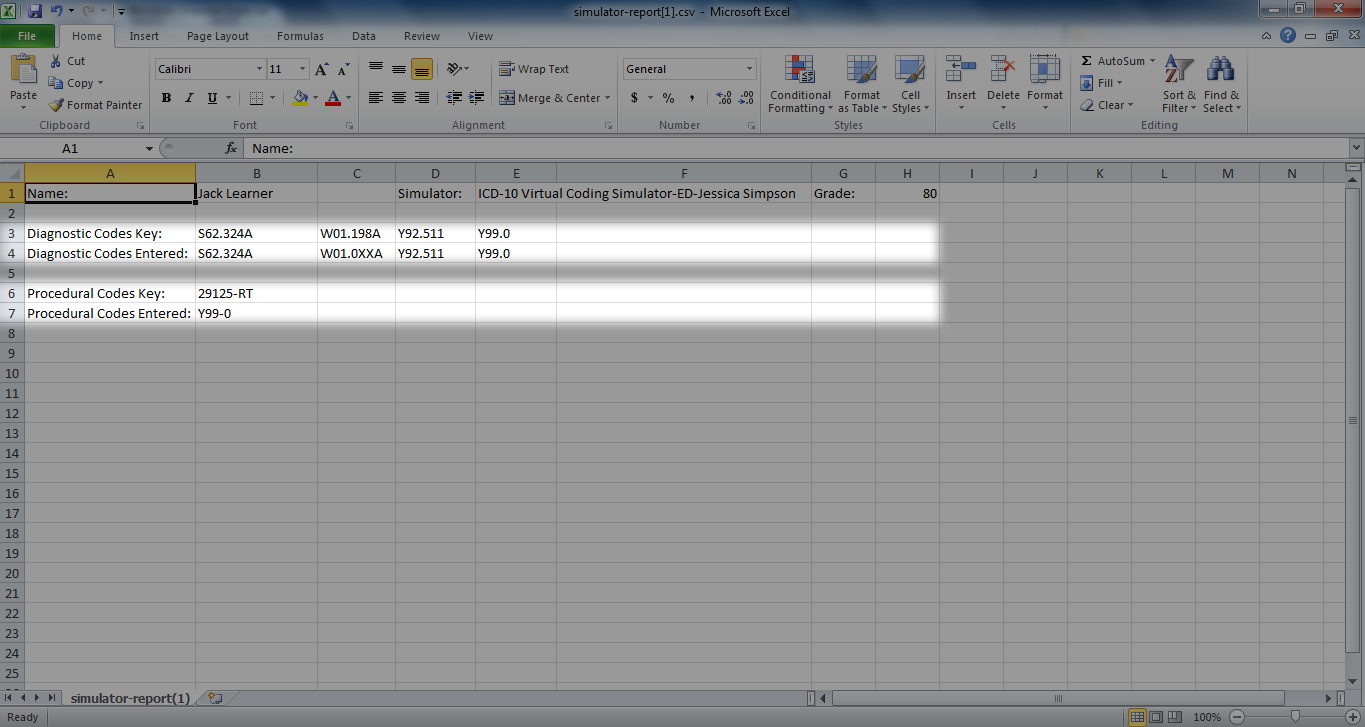
In the Excel spreadsheet, the first line includes the Name of the learner, Simulator Name, and Grade.
Line 3 indicates the correct answers and Line 4 indicates the answers the user input for the Diagnostic Assessment.
Line 6 indicates the correct answers and Line 7 indicates the answers the user input for the Procedural Assessment.
Assessment Reporting

Click the  next to the Cohort you lead and click on the Completion Report option.
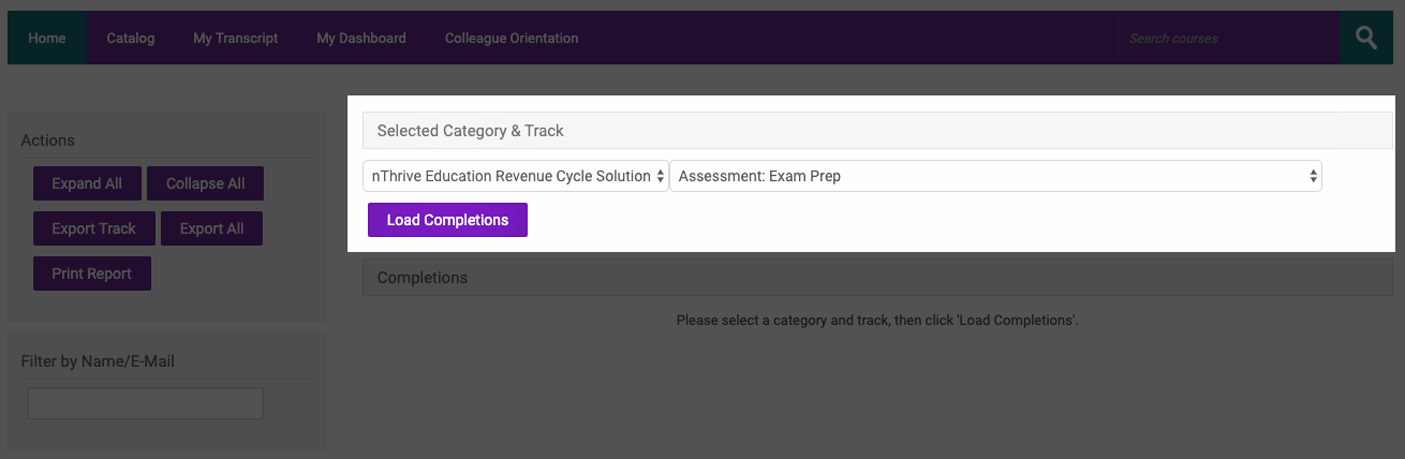
Select the Category and Track at the top of the page and then click Load Completions. Using the filters on the left-hand side, locate the learner you would like to view by clicking on their Cohort, job, department, and/or facility.
Click on the icon on the left of the learner name to expand the Track and view the Courses. This provides an overview of enrollment dates, when the learner started/completed the course, number of attempts, and grade for each course.
Click on the course to view and a CVS file will begin to download in your browser. Click Open to open the file.
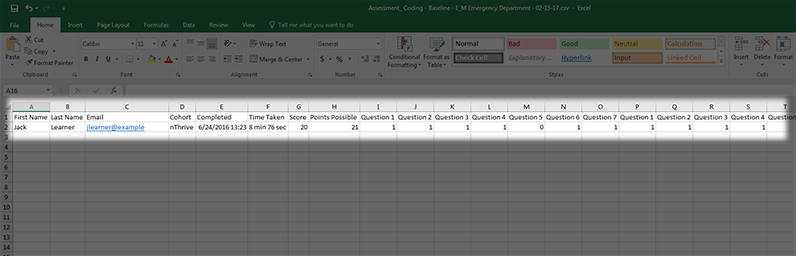
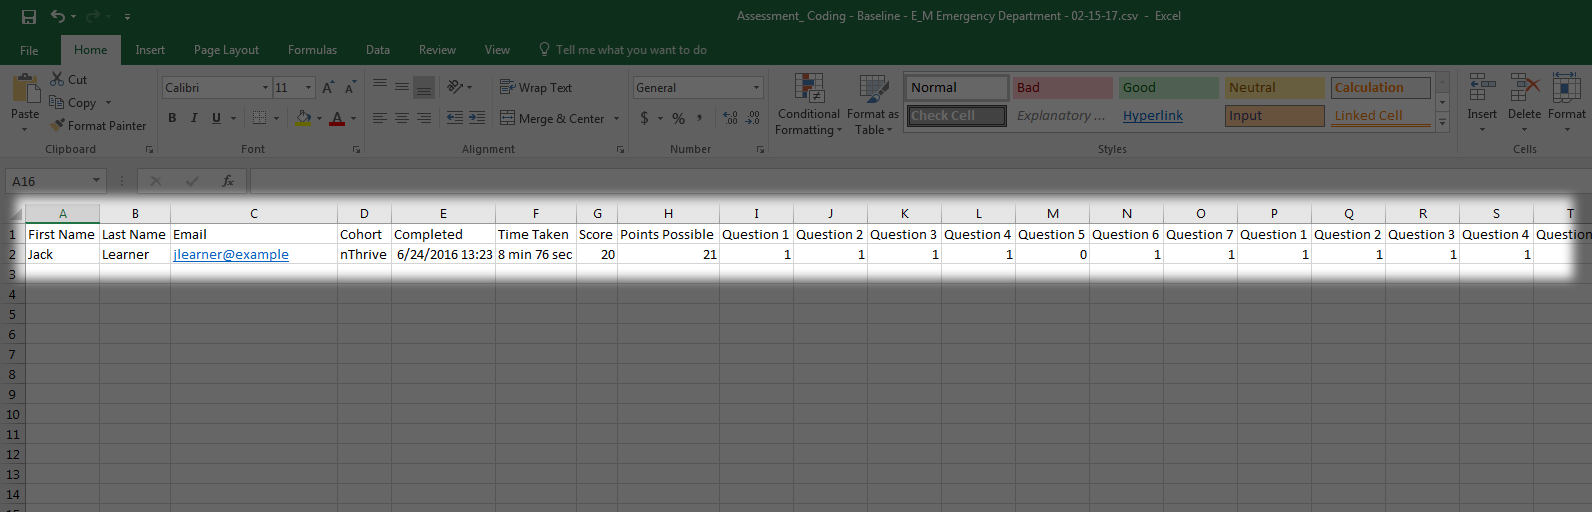
In the Excel spreadsheet, the first four columns include the Name of the learner, email, and Cohort(s).
The next four columns display the date/time of the attempt, the total time the learner took to complete the assessment, the learner’s total score, and the total points possible for the assessment.
The remaining columns contain the points the learner received for each question. The questions are in order of each section. If the question has 0 points, the response was marked incorrect. If the question has a point value, the learner got the question correct.